

Audio By Carbonatix
The Commissioned masterpiece
Quite a few people have sent me a report seemingly commissioned by the GoldBod and written by three economists, some with very strong ties to government institutions in the finance and economic sectors.
One author, for instance, has a longtime association with the Monetary Policy Committee of the Bank of Ghana (BoG). Another works at the controversial state-owned Development Bank of Ghana. And the last frequently consults for government institutions such as the Ghana Export Promotion Authority and was a member of the much lamented E-Levy’s Technical Committee.
The GoldBod seems very enthusiastic about the report. Not surprising considering the gushing tone. Nonetheless, no conflicts were disclosed in the paper/”report”, so we will leave things at that.
The paper’s expressed purpose is to evaluate the “macroeconomic effects” of the GoldBod, not necessarily to conduct a detailed, balanced, cost-benefit analysis. But it ends up delivering a benefits analysis without looking much into the costs as analysts like Alfred Appiah have already noted on X (formerly Twitter).
The Heart of the Debate
The GoldBod is the main supplier of gold dollars to the Bank of Ghana’s “Gold-for-Reserves” (G4R) program, which was ostensibly designed to staunch the haemorrhage of foreign exchange (FX) earnings, formalize the “galamsey” sector, and bolster the cedi against chronic depreciation.
On the surface, the headline metrics appear to vindicate this intervention: gross international reserves have recovered to approximately $13.8 billion, and the cedi has enjoyed a period of relative stability following the tumultuous volatility of 2022 – 2023.
However, a forensic examination of the underlying factors triggered by a disclosure of $214 million in losses in the first three quarters of 2025 (likely to have exceeded $300 million by year-end 2025) by the IMF provides yet another proof point for the wisdom of never succumbing to glossy headlines.
Which is why we must view some of the claims in the aforementioned paper/report, “Evaluating the Macroeconomic Effects of the Ghana Gold Board (GOLDBOD)”, with extreme professional and analytical scepticism.
In tallying the benefits side of the ledger, the paper fails to conduct any serious counterfactual analysis or multi-differential impact analysis to sift out the contributions of other factors in a rigorous way.
For example, their attribution of cedi stability to GoldBod ignores the ongoing role of the external debt relief, which some analysts estimate as saving the country approximately $3 – 4 billion annually in outflows, however painful for investors that is. One analyst claims that this is old news long factored into the macroeconomic ledger. His is a deeply flawed view since it assumes that the exchange rate is solely the product of sentiment and forgets about the ongoing impact of the debt restructuring exercise on actual structural forex demand for external debt servicing.
Furthermore, we will challenge “formalisation shock” hypothesis proposed in the GoldBod-benefits report. First, as Appiah has pointed out, the increase in artisanal and small-scale gold mining (ASM) output since the GoldBod’s legal formation in May 2025 or since it commenced full commercial operations in July 2025, or even since the Gold for Reserves program started in 2022, does not exhibit a pattern all too different from previous hard to explain output jumps and declines.
| Year | Output (Tonnes) | Output (Million Ounces) | Key Context & Remarks |
| 2025 | 100.6 | 3.23 | Local premium policies introduced by government in desperate need for “gold dollars”. |
| 2024 | 63.6 | 2.05 | Significant recovery; aggressive competition for gold by government agents. |
| 2023 | 34.2 | 1.1 | Gradual recovery following the 2021 collapse. |
| 2022 | 20.5 | 0.66 | Sector struggled with taxation and regulatory enforcement. |
| 2021 | 3 | 0.1 | Historic Low: official output plummeted ~91% due to new 3% withholding tax. |
| 2020 | 36.5 | 1.18 | Strong performance prior to tax policy changes. |
| 2019 | 29.8 | 0.96 | Slow recovery following the lifting of the ban on small-scale mining. |
| 2018 | 18.2 | 0.59 | Low output due to the ongoing ban on small-scale mining (galamsey). |
| 2017 | 25.4 | 0.82 | Ban on small-scale mining imposed mid-year to curb environmental damage. |
| 2016 | 49 | 1.57 | Previous peak era before the government crackdown. |
| 2015 | 31.9 | 1.03 | Steady production levels. |
| 2014 | 46.4 | 1.49 | High production driven by gold prices. |
| 2013 | 44.4 | 1.43 | Small-scale sector contributes significantly to national total. |
| 2012 | 43.1 | 1.39 | Consistent growth in the sector. |
| 2011 | 29.8 | 0.96 | Expansion phase of small-scale mining. |
| 2010 | 23.9 | 0.77 | Base year for this analysis. |
In fact, between 2022 and 2024, there was a 300%+ jump in official ASM gold output despite there being no GoldBod. Between 2010 and 2012, there was a near 100% jump in output. And between 2018 and 2020, there was another near-100% hike in production. What all this says is that the sector is sensitive to market developments and is quite idiosyncratic.
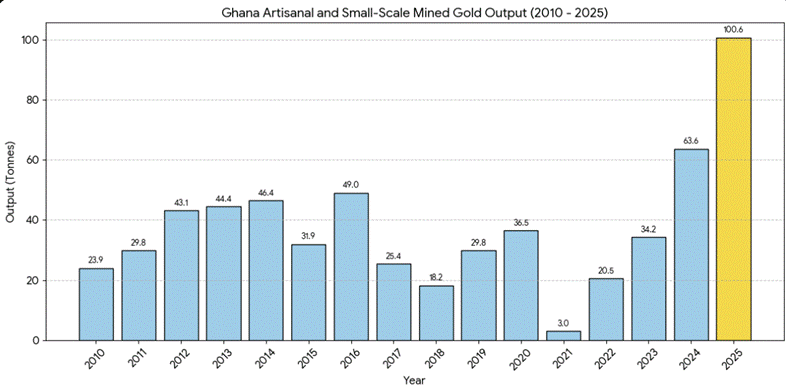
Ascribing a 60% increase in production last year to a single institution (GoldBod) without paying attention to a history of idiosyncratic movements damages the credibility of the analysis.
The GoldBod-benefits paper go to exasperated lengths to “prove” that a price rally could not have accounted for the hike in production between 2024 and 2025, following the lead of some commentators in recent days. This is despite clear evidence that the effect of the global price rally in Ghana was compounded by the presence of so-called “bonuses” (premiums) which at times led to prices higher than LBMA spot (a measure of the world market price for gold). Nevertheless, this has become a sticky point in the debate, and thus warrants additional treatment.
Dissecting the Price+Premium Effect on Production
An increase in the global gold price serves as a potent, immediate, accelerant for the Artisanal and Small-Scale Mining (ASM) sector in Ghana. Unlike Large-Scale Mining (LSM) companies – which are bound by long-term mine plans, fixed capital structures, and rigid regulatory frameworks, ASM operators (both legal and illegal/galamsey) have flexibilities that enable a higher supply elasticity. They can ramp up production almost instantly in response to price signals, when certain conditions allow.
Let’s explore some of these flexibilities and dynamics.
- When gold prices rise, the “cutoff grade”, the minimum concentration of gold in the ore required to make mining profitable, drops significantly. This changes how ASM miners manage their own sites. Due to their lower/fewer environmental constraints, they are able to make quicker adjustments in operations to benefit from the higher market prices.
- For example, in low-price environments, ASM miners target only high-grade veins. As prices rally (e.g., the surge to >$2,600/ounce in 2024/2025), waste dumps and “tailings” (residue from previous processing) suddenly become “marginal reserves.” Miners return to previously abandoned pits to re-process waste using cyanide heap leaching, effectively squeezing “new” gold from “old” ground without digging fresh pits.
- High prices allow miners to clear land that was previously considered too lean. For example, during the 2011 – 2012 bull run, alluvial mining in the Eastern Region expanded from riverbeds (high grade) to riverbanks and surrounding farmlands (lower grade), as the inflated price subsidized the higher cost of excavation.
- One of the most volatile consequences of price rallies is the aggressive management of “portfolio” land. Large-scale miners (like AngloGold Ashanti or Gold Fields) hold vast concessions. They categorize deposits as “Proven/Probable Reserves” (mined now) and “Marginal Resources” (held for the future). To the ASM miner, a multinational’s “marginal” reserve is often a “bonanza” grade deposit, especially during price rallies. The only inhibition being the cost of paying off regulators and law-enforcement officers to “turn a blind eye.”
- During price spikes, the opportunity cost of not mining becomes too high for local galamseyers. They aggressively encroach on the idle outer perimeters of LSM concessions.
- Example: as gold prices recovered from 2015 lows, thousands of illegal miners invaded AngloGold Ashanti’s Obuasi mine. The mine was in a “care and maintenance” phase (idle), making it a prime target. The invaders didn’t just target surface soil; they accessed high-grade underground tunnels, effectively treating the multinational’s reserve as their own “marginal” portfolio to be liquidated immediately.
- When encroaching, ASM miners practice “high-grading”. I.e. they rapidly extract the richest ore and leave the rest. This destroys the geological integrity of the deposit, often rendering the remaining lower-grade ore economically unviable for the large-scale license holder to mine later.
- In Ghana, gold and cocoa compete for the same land and labor.1 This relationship is heavily dictated by their relative prices.
- When gold prices rally while cocoa prices remain stagnant or payment is delayed (as seen in the 2020s), the labor force migrates. Farmers sell or lease their land to miners for an immediate lump sum (often calculated based on the current gold price) rather than waiting for seasonal cocoa harvest payments. This shift injects a massive surge of manual labor into the mining sector.
- Between 2011 and 2017 (a volatile period for gold), cocoa’s contribution to GDP fell from 3.6% to 1.8%, partly due to the conversion of cocoa lands into illegal mines (galamsey). The high gold price effectively “purchased” the land from the agricultural sector.
- A sustained high gold price does not just mean more digging; it also means faster digging.
- In a low-price environment, ASM is dominated by pickaxes and shovels. In a high-price environment, the initial windfall is immediately reinvested into mechanization.
- High cash flow allows gangs to rent or buy excavators ($500+ daily rental). One excavator can move as much earth in a day as 100 men can in a week.
- he proliferation of these floating crushing platforms on water bodies (like the Pra and Ankobra rivers) correlates directly with price rallies. The high price of gold justifies the capital expenditure (CapEx) of building these machines.
- This mechanization creates a non-linear jump in output. A 10% increase in price might lead to a 50% increase in output because it funds the transition from manual to mechanical mining in some sectors.
Of course, there are constraints in terms of available land, available labour, and the attitudes of regulators and law-enforcement officials. Hence, scaling in response to price rallies cannot be a smooth, linear, process. But it is completely uncritical to claim emphatically that price rallies, especially the unprecedented ones we have seen in 2024 to 2025, have no significant effect in spurring production.
Summary of Price Impact on ASM Behavior
| Behaviour Factor | Low Gold Price Scenario | High Gold Price Scenario | Impact on Output |
| Reserve Selection | Only high-grade veins/riverbeds mined. | Low-grade soils, waste dumps, and tailings re-processed. | Increases (Volume & efficiency) |
| Land Access | Focus on family lands or legal small plots. | Aggressive encroachment on LSM concessions and protected forests. | Increases (Access to better ore) |
| Labour Market | Labour remains in Cocoa/Agriculture. | Mass migration of youth/farmers to mining sites (“Galamsey”). | Increases (Manpower surge) |
| Technology | Pick-axes, shovels, pans. | Excavators, Crushers, Changfans, Cyanide leaching. | Multiplies (Speed of extraction) |
Regional laundering
Moreover, a forensic analysis of export data suggests that the recent surge in recorded gold exports (from 63.6 tons in 2024 to 103.0 tons in 2025) may partially reflect a “Transit Gold” phenomenon, where the premium prices offered by GoldBod (the “Accra Premium”) at various points have incentivized the smuggling of gold into Ghana from neighboring jurisdictions like Burkina Faso and Mali, effectively subsidizing regional illicit flows with Ghanaian public funds, as analysts at EITI have noted.
The Treadmill Effect
Most critically, we expose the “Treadmill Effect” of the program’s financing model. The central bank, acting as the financier of first resort, engages in high-powered money creation to fund gold purchases at a premium. This liquidity injection necessitates aggressive sterilization through Open Market Operations (OMO), the costs of which may have amounted to GH¢8.6 billion in 2024 alone. These costs create a recurring “negative carry” that erodes the net benefit of reserve accumulation and constitutes a quasi-fiscal deficit currently kept off-budget.
In fact, we go beyond textual analysis and introduce a basic web model that should simplify the complexities of the analysis for the general public: https://www.katanomics.org/essays/BBSimons/goldbod
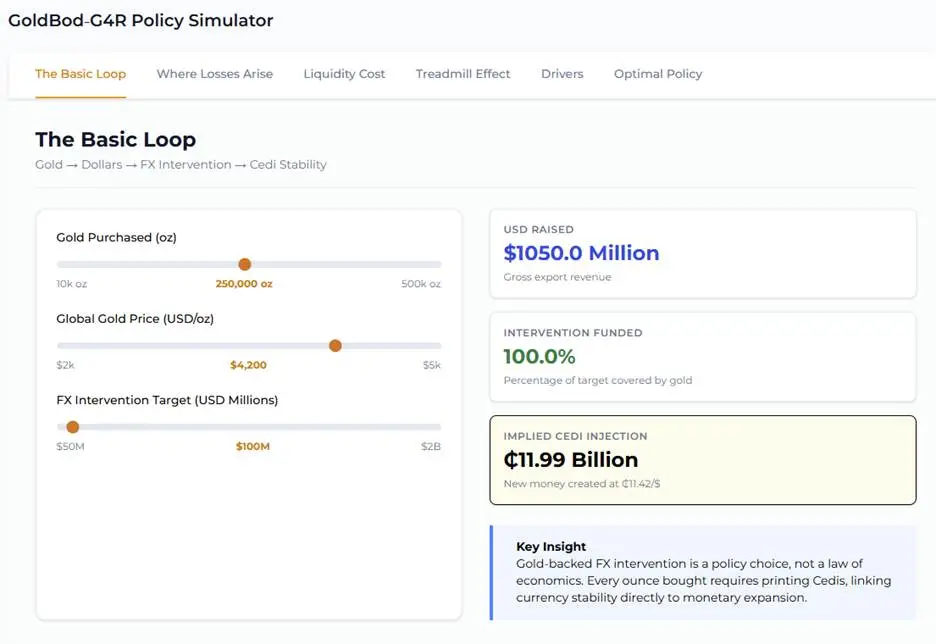
Our use of digital tools for simplification is consistent with our recent mandate to spur the creation of “critical policy audiences” within the broad Ghanaian public to stem the “katanomic crisis” in Ghanaian policymaking.
The anti-katanomic modelling dashboard above should help the public appreciate that while the GoldBod-G4R program has successfully centralized gold flows, and pushed the bulk of gold dollars away from other players in the economy (such as Banks), it has done so by creating a pro-cyclical “bear trap.”
Meaning: the system is heavily leveraged on historically high gold prices. Should prices correct, the cost of maintaining the same level of FX intervention would require even greater liquidity injections and higher sterilization costs, precisely when the asset backing the operation is losing value.
The Weak “Formalisation Shock” Hypothesis
The GoldBod-benefits paper is being positioned as an expert-academic vindication of the program. However, a granular scrutiny of the methodological choices reveals significant biases that render the paper a policy defense document rather than an independent audit.
Some of this bias is discernible in the heavy reliance on the “Formalisation Shock” hypothesis. The authors observe that recorded ASM gold exports surged from 63.6 tons in 2024 to 103.0 tons in 2025 and attribute this entire increment (39.4 tons) to the successful formalization of previously smuggled domestic gold. They value this increment at $3.8 billion and count it as a net benefit.
Appiah has already shown by simple reference to the historical trend of ASM gold production in Ghana that we have seen massive jumps in output in the past that even exceeds the 2024 – 2025 leap. But the attribution suffers from another big gap: it ignores the regional arbitrage factor. The paper fails to control for the possibility that the “GoldBod Bonus” (pricing gold above world market rates) has incentivized the smuggling of gold into Ghana from neighboring Burkina Faso, Mali, and Côte d’Ivoire. This is a phenomenon corroborated by independent analysts.
If Ghana pays a premium, it becomes a magnet for regional gold. Counting this “transit gold” as a triumph of domestic formalization is a categorical error. It flatters the export data but hides the fact that the BoG is effectively subsidising regional miners with Ghanaian public funds.
We will return to these points in detail again as they are so important.
A Benefit-Cost Fallacy: Gross Inflows versus Net Economic Cost
The paper’s central quantitative argument is a cost-benefit analysis where “benefit” is defined as the gross value of FX inflows ($3.8 billion) and “cost” is limited to the reported trading loss ($214 million), yielding a ratio of ~18:1. This is mind-bogglingly naïve.
By means of such economic sleight-of-hand, the authors gloss over the fact that Gross FX inflow is a liquidity metric rather than a welfare metric. The true economic benefit is the value added by that liquidity, minus the full cost of acquiring it. By excluding the massive costs of sterilization (interest on BoG bills) and the opportunity cost of the capital employed, the authors present a grossly distorted picture. They essentially argue that buying $1 for $1.05 is a success because you now have $1 in hand. This logic would bankrupt any private entity; applying it to sovereign resources is nothing short of dangerous.
Volume versus Value Retention
The narrative of GoldBod is that it “captures” gold that was previously lost. However, the data shows that while volume passing through the BoG has increased, the cost of capturing that volume has skyrocketed.
In 2021, the BoG received gold dollars largely as a regulatory requirement (surrender portion) from large mines at zero marginal cost to the state (other than the opportunity cost of allowing retention). In 2024/2025, the BoG is buying the gold. It is swapping Cedi assets for Dollar assets.
Evolution of Gold-Related Flows
| Year | Total FX Inflows ($bn) | Gold-Related Inflows ($bn) | Mechanism | Cost to State |
| 2021 | 14.59 | ~1.0 (Surrender) | Regulatory Mandate | Zero (Regulatory) |
| 2024 | 11.99 | ~4.46 (Minerals/Purchases) | Direct Purchase | High (Premium plus Interest) |
The shift from a regulatory surrender regime to a direct purchase regime means the state has moved from a passive beneficiary to an active, risk-taking trader. The “increase” in inflows is funded by debt (BoG bills), rather than by organic economic growth.
The mistake that most members of the public make is to assume that the GoldBod is somehow responsible for the creation of $10.3 billion in new value for the economy. They forget that the government is simply aggregating Dollars from miners and traders and then selling it back to importers, sometimes at a subsidised rate due to the aggressive peg of the Cedi to the Dollar. There is no “new value” being created per se.
The easiest way to appreciate this point is to ignore, for one moment, the Bank of Ghana’s reserves story and focus on what has been happening at the commercial banks.
| Year | Total forex “earned through dealer commercial banks” (USD) | Notes |
| 2018 | 25.952bn | Pre-2021 template (including “Financial Transactions” and combined “Transfers/Remittances”). |
| 2019 | 12.698bn | Notice the massive drop. |
| 2020 | 24.822bn | Notice the sharp recovery. |
| 2021 | 30.938bn | Continued expansion (methodological changes at BoG improves clarity of reporting) |
| 2022 | 35.343bn | Continued expansion. |
| 2023 | 41.391bn | Continued expansion. |
| 2024 | 50.101bn | Step-change upward due to export performance pickup. |
Between 2019 and 2024, forex transactions at the commercial bank window increased by more than 400%. Entirely market-driven. In the same vein, transactions more than halved between 2017 and 2019. In a system capable of such massive forex swings. It takes a lot of chutzpah to reduce the forex supply channel of impact on the exchange rate to just the supply of gold-dollars from GoldBod for episodic BoG interventions. A much more elaborate analysis is required before the authors of the GoldBod-benefits can make the claims they did in their paper.
Of course, during a crisis period where disorderly conditions in the market needs to be tamed, the central bank’s “smoothing” power requires a concentrated forex stash. What we must not do is confuse a tool for emergency stabilisation with an optimal routine policy.
Mirror Data Discrepancies: The UAE-Switzerland-Ghana Discrepancy
Historically, UAE import data for gold from Ghana has consistently exceeded Ghana’s reported exports by billions of dollars, providing analysts with the best empirical signal for “smuggling”.
Unfortunately, some have elevated this useful gap-filler into an all-round justification for GoldBod’s anti-smuggling prowess even though the 2025 UAE-Ghana discrepancy data for Ghana is not officially out (fragments of that data exposed in confidence to this author for certain periods in 2025 does suggest that such gaps may still exist by the way).
Yet, the presence of such gaps can result from a confusing set of factors such as import/export valuation, period-bounding, routing/origin classification issues, product/HS-scope mismatches, timing mismatches, and/or reporting/valuation differences tied to contract structure and customs valuation.
Below, to illustrate the above point, I present data I pulled from the data portal of the Indian Ministry of Commerce & Industry for the gold trade between Ghana and India.
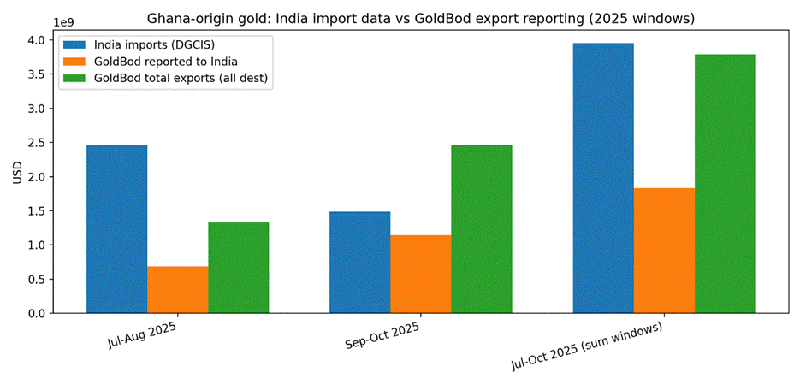
| Period | Quantity (KG) | Value (USD) |
| April – July 2025 | 10,386 | $1,030,945,750 |
| July – August 2025 | 9,752 | $974,272,855 |
| August – September 2025 | 11,209 | $1,180,389,122 |
| Sept – Oct 2025 | 13,061 | $1,488,645,851 |
| Total (Apr – Oct) | 28,051 | $2,979,387,898 |
At first glance, it shows persistent gaps between import and export data covering the gold trade between the two countries. It would be naïve to describe this as evidence of smuggling without painstaking granular analysis.
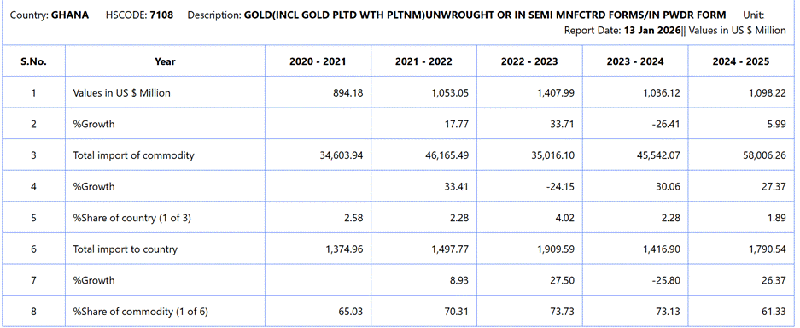
The Swissaid report that everyone relies on when analysing the Ghana – UAE discrepancies note also that the discrepancies on the Ghana – India leg are very minimal (see historical data below). And, yet, as clearly demonstrated above, those discrepancies appear to have taken a wild turn since the Domestic Gold Purchasing Program intensified in late 2024.
Allow me to present a range of deeper considerations one need to keep in mind when attempting to analyse discrepancies of the type the GoldBod-benefits paper strives to latch the smuggling thesis on.
- The GoldBod usually declares manifests that consistently list the gold exported from Ghana as “GOLD BULLION” under the bullion HS Code. In the HS nomenclature, the bullion code typically implies refined bars of 99.5% purity or higher.
- The Indian buyers of GoldBod’s gold – such as Sovereign Metals Limited, Augmont Enterprises, and Narrondass Manordass – are primarily refineries. Under Indian law, refineries import under the “Actual User” condition to refine unrefined gold. To avail of the lower customs duty (5.35% for dore versus 6% for bullion), they must classify the import as “Gold Dore” under the respective HS Code.
- There is thus a fundamental mismatch. Ghana declares the export as high-value “Bullion.” It is not clear why so. Perhaps to project value-addition and compliance with international standards? India records the import as “Dore” to satisfy tax efficiency requirements.
- A substantial volume of Ghanaian gold flows through the United Arab Emirates (UAE) before reaching India, creating a “triangular trade” dynamic.
- The export destination might be recorded as “UAE” if the financial counterparty is based in Dubai (e.g., Wellgold DMCC andPinnacle I FZCO).
- The import is recorded as coming from “Ghana” if the Certificate of Origin is preserved during transshipment. However, if the gold is re-melted or re-invoiced in Dubai’s free zones (DMCC), it may be recorded as an import from the UAE.
- In the GoldBod manifests, shipments to “WELLGOLD DMCC” are listed with “Destination Country: INDIA”. This explicitly confirms the triangular nature of the trade. The gold physically moves to India, but the financial settlement and paperwork route through Dubai. A situation that introduces timing lags (e.g. shipping and customs clearance in Dubai) and valuation changes (mark-ups by Dubai intermediaries), leading to statistical mismatches in bilateral databases.
- Looking at the table extracted from the Indian Ministry of Commerce & Industry’s portal, there could be discrepancies of up to $2.3 billion in historical data due to this specific routing mechanism.
- The value recorded by GoldBod is the Free on Board value. This is the price of the gold at the point of exit (Accra), excluding transport and insurance.
- The value recorded by the Indian Ministry of Commerce is the Cost, Insurance, and Freight value.
- This can all get complex quickly. CIF Value = FOB Value + Freight + Insurance.
- Air freight for high-value cargo like gold is expensive due to security premiums. Rates from West Africa to India via secure carriers can be significant.
- Gold shipments require “All Risk” insurance, typically 0.05% to 0.1% of the value.
- GoldBod pays a “bonus” to local miners to disincentivize smuggling. If this premium is baked into the FOB price, the Ghanaian export value might be higher than the standard London fix. Conversely, if Indian importers are buying at a discount (standard for dore), the CIF value might not reflect the full “bullion” price.
- To reconcile the figures, one must adjust the Ghanaian FOB value upwards by approximately 0.5% to 1.0% to estimate the Indian CIF value. Any discrepancy beyond this margin suggests under-invoicing (tax evasion) or data leakage via third countries.
Without anything approaching that level of granularity and sophistication in analysis, the GoldBod-benefits paper proclaims the GoldBod as having extinguished smuggling networks and formalised previous smuggling networks.
Loss Dynamics
As we have already shown elsewhere, the trading losses recorded by the GoldBod aren’t due merely to “translational accounting effects” as the GoldBod-benefits paper’s authors sought to suggest. The losses are structural, and embedded in the very design of the G4R pricing model.
To displace the efficient private network of buyers, GoldBod must offer a price that clears a distorted market, inclusive of a “bonus.”
- Example: On December 10, 2025, the LBMA benchmark was $4,196/oz. GoldBod’s effective purchase price, factoring in the GHS 650/pound bonus and the official exchange rate, was ~$4,435/oz.
- Result: This represents a 5.7% premium over the world price. This “Accra Premium” creates a powerful arbitrage signal. It is more than just an incentive for local miners; it is a beacon for regional gold flows, attracting supply from countries where the price is closer to spot.
Combining the buying premium and selling discount for trades of that nature reveals the structural rot.
- Buying: Spot + 1.3% to 5.7%
- Selling: Spot – 4.0%
- Net Margin: -5.3% to -9.7%
For every $1 billion of gold traded, the state can easily lose between $53 million and $97 million in direct trading value. This explains the IMF’s $214 million figure. It is not a “paper loss”; it is the cost of buying market share.
Yet, the GoldBod-benefits paper twists its knickers into knots in an attempt to underplay such a fundamental issue.
The paper also ignores the implicit “Printing” for Gold dynamic
The BoG does not buy gold with tax revenue. It buys gold by either, in a minority of situations, managing swaps with commercial banks in which the banks have no downside risk because the central bank absorbs all of it, or, in the majority of cases, crediting the accounts of aggregators with newly created Cedis. For a batch of 250,000 ounces at ~$4,255/ounce (approximately GH¢12.1 billion), the monetary base (M0) expands instantly.
In an inflation-targeting regime, albeit one distorted by an undisclosed secondary anchor (the currency peg), such a massive injection of high-powered money is dangerous. To prevent inflation from spiralling (which would weaken the cedi the program is trying to save), the BoG must “sterilize” this injection. It essentially takes the money back out of the system by selling BoG Bills to banks.
The cost of this operation is the interest paid on the bills, as mentioned several times in the past.
- Interest Rate: The BoG policy rate hovered around 29% for much of 2024 before easing to 27% and then 21.5% later in 2025. It ended the year below 15%.
- Impact: In 2024, the BoG spent GH¢8.6 billion on Open Market Operations (OMO) costs alone. This is a staggering sum, representing a direct transfer from the central bank to the commercial banks holding the bills.
- Net: The annual interest cost to sterilize the funds for a single 250,000-ounce batch of gold can hit ~$230 million. And generate recurrent effects depending on how reserve retention is treated.
These OMO costs are quasi-fiscal. They function like government borrowing but do not appear in the budget deficit reported by the Ministry of Finance. They appear as “operating losses” on the BoG’s balance sheet and will likely exacerbate the negative equity position of GH¢61.32 billion reported at the end of 2024. This is a hidden debt accumulation mechanism that future taxpayers will eventually have to recapitalize.
I find it very hard to fathom why the GoldBod-benefits authors would completely ignore all these entries in the ledger and yet purport to be engaged in a dispassionate analysis of costs and benefits.
Other contributions to the Cedi Stability story totally ignored
Of course, no mention is made of the more than $2.5 billion the IMF has injected into the economy when the issue of inflows comes up.
But surely, even a paper focused on making GoldBod look good can still try to engage more analytically with a few of the other drivers of the BoG’s reserves accumulation trajectory?
In January 2024 Ghana agreed an Agreement-in-Principle (AIP) with its Official Creditor Committee (Paris Club countries and China, among a few others) covering about US$5.17 billion of bilateral loans (cut‐off Dec 2022). Under the agreed terms, Ghana will receive roughly US$2.85 billion in debt‐service relief over the 2023 – 26 time period. This reflects lower principal repayments and interest (e.g. through extended maturities and grace periods).
Separately, Ghana finalized a debt exchange with private Eurobond holders. In October 2024, it restructured US$13.1 billion of sovereign bonds. Creditors took a ~37% nominal haircut, reducing the outstanding principal by about US$5 billion and cutting the average coupon from ~8% to ~5%. The Eurobond deal yields roughly US$4.3 billion of debt‐service savings during the 2023 to 26 timeframe (both principal and interest).
In total, therefore, Ghana’s external debt restructurings are projected to cut external debt‐service obligations by about US$9.68 billion over the medium term (2023 to 26), which is roughly US$2.7 to 2.9 billion per year on average.
What is important is that those savings compound as each new agreement is reached and terms become effective. Those amount to forex obligations that the Bank of Ghana no longer needs to release dollars to support the government in payouts to creditors.
At the same time that the Bank of Ghana’s dollar obligations have diminished, the country is facing a significant slowdown in secular imports growth that has led to a trade surplus of roughly $8.5 billion in recent times. Essentially, Ghana’s goods exports generated $8.5 billion more than the country needs for goods imports. Of course, one must account also for the service imports and other payment obligations, but a good look at the current account position shows that all these have moderated in recent times.
Then there is the general effects of sterilisation (beyond the cost issues we have raised), which removes Cedis that would have otherwise gone chasing Dollars from circulation.
The GoldBod benefits paper casually browses through such possible contributory elements but it makes virtually no effort to quantify their differential contribution to the relative stability.
Because the sterilisation and liquidity management issues are so critical in appreciating the full life-cycle of the gold-for-reserves policy and the GoldBod mechanism that underwrites it, we have dedicated the brief section that follows exclusively to explaining our stance.
The Sterilisation Bogey
Under a standard Inflation Targeting (IT) framework, which is the dominant posture of monetary policy in Ghana, the Central Bank sets a Monetary Policy Rate (MPR) to anchor inflation expectations. It manages the interbank interest rate to align with this MPR using Open Market Operations (OMO). Liquidity in the banking system is influenced by two primary autonomous factors:
- Net Foreign Assets (NFA): When the Central Bank purchases foreign exchange (or gold), it injects local currency into the banking system, increasing NFA.
- Net Domestic Assets (NDA): When the Central Bank lends to the government or provides liquidity support to banks, it increases NDA.
The sum of NFA and NDA constitutes Reserve Money (RM) or High-Powered Money.
ΔRM = ΔNFA + ΔNDA
If the increase in RM exceeds the level consistent with the inflation target, the Central Bank must “sterilize” the excess. It does this by selling BoG Bills to commercial banks. This operation reduces the banks’ excess reserves but creates an interest-bearing liability for the Central Bank. The interest paid on these bills constitutes the Sterilization Cost or OMO Cost.
The mechanics of the Gold-for-Reserves program related to this issue are as follows:
- The Bank of Ghana (BoG) purchases dore gold from local aggregators (through GoldBod) and refined gold from mining firms.
- Crucially, these purchases are settled in Ghana Cedis (not US Dollars). Whilst the BoG does mobilise some Cedi funds from commercial banks for these purposes (effectively selling them a swap), which itself involves a subsidy due to the trading losses described earlier, the bulk of the Cedi resources for the program are generated by the BoG crediting the commercial bank accounts of the sellers with newly created Cedis.
- This transaction immediately increases the NFA of the Bank of Ghana (Gold is a foreign asset) and simultaneously increases Reserve Money (Bank Deposits).
- To prevent this massive injection of cedi liquidity from crashing interbank rates and fueling inflation, the Bank must immediately mop it up. It issues short-term BoG Bills (14-day, 56-day, etc.) to absorb the liquidity.
- The Financial Cost: The Bank holds the gold (which yields 0% interest) but pays high interest (e.g., 29% in 2024) on the BoG Bills used to sterilize the purchase. This creates a negative carry trade on the central bank’s balance sheet, manifesting as the surging OMO Costs observed in 2023 and 2024.
To discern the effect of this process on the reserve money trajectory in Ghana requires, first of all, an accounting for baseline effects. Because the response to the COVID-19 pandemic involved a massive surge in Cedi liquidity, a naïve tracking of reserve money would fail to capture the scale of sterilisation associated with the domestic gold purchasing programs.
Moreover, in 2023, Ghana entered into a US$ 3 billion Extended Credit Facility (ECF) with the IMF. A core conditionality was the cessation of monetary financing of the fiscal deficit. This shifted the driver of liquidity from fiscal injection (NDA) to reserve accumulation (NFA) and required the Bank to aggressively mop up the existing liquidity overhang.
Thus, the Bank of Ghana’s 2024 financial statements reveal that the cost of Open Market Operations reached GH¢ 8.60 billion. A secondary cost of operation, currency printing, rose to GH¢ 1.01 billion in 2024 from GH¢ 0.69 billion in 2023, reflecting the nominal expansion of money demand. The end-result was that Total Operating Income (GH¢ 9.40 billion) was completely consumed by Total Operating Expenses (GH¢ 18.89 billion). The GH¢ 8.60 billion OMO cost accounted for 45.5% of total operating expenses, confirming it as the single largest driver of the central bank’s deficit.
In 2024, the Bank absorbed a total of GH¢ 134 billion in liquidity through its operations. This massive figure underscores the scale of the sterilization required to counteract the liquidity injected by gold purchases and other autonomous factors.
Despite this massive absorption, reserve money continued to grow, driven entirely by the NFA component (gold and FX accumulation). The Bank successfully kept reserve money within the IMF program’s indicative targets, preventing a resurgence of hyperinflation.
The only thing that has abated the costs somewhat in 2025 is that the policy rate fell throughout the year. The reduction in the rate implies a significant deceleration in the accrual of OMO costs in Q4 2025. Based on the run-rate of GH¢ 8.6 billion in 2024 and the significant rate cuts in late 2025, the total OMO cost for 2025 is projected to moderate to the range of GH¢ 6.5 – 7.5 billion. This should not however deceive observers into underestimating the scale of sterilisation operations involved. As of July 2025, according to briefings by the Governor of the Bank of Ghana to Parliament, the volume of sterilisation already exceeded GH¢ 60 billion.
Triangulating the policy rate reduction, the OMO costs projected for 2025, and the reserve money growth rate consistent with the IMF program, yields a composite view of an aggressive level of sterilisation operations, perhaps unprecedented in recent times.
The paper says nothing about comparative experiences elsewhere
Comparing Ghana’s GoldBod to peer programs highlights important divergences in design and outcomes:
- Philippines (Bangko Sentral): Since the 1970s the BSP has had a Domestic Gold Purchase Program, buying local ASM gold to build reserves. Critically, the BSP owns an LBMA-accredited refinery, so all purchases meet international audit standards. In Ghana’s case, the matter of the state-backed refinery is shrouded in utmost murkiness and confusion. In 2020, the Philippine government reversed punitive taxes (2% excise plus 5% withholding) that had decimated the program’s volume. Under the revised regime, the BSP resumed large-scale ASM buying and formalization. Key lessons: transparent processes, multiple buyers, alignment with global standards. Ghana’s GoldBod, by contrast, centralizes buying into one firm (Bawa Rock) and has not disclosed any LBMA-like oversight or third-party audit of sources. The Philippine experience shows formalization can work, but not via monopolistic, opaque channels.
- Mongolia (Bank of Mongolia): As an emerging gold producer, Mongolia systematically incorporates ASM gold into reserves. In 2024, BoM began treating gold as a separate reserve asset with a dedicated portfolio. It purchases ~18 – 20 tonnes/year of domestic gold from large mines and ASM, exclusively through commercial banks. It pays global prices and has signed on to World Gold Council’s London Principles for responsible sourcing (requiring LBMA Good Delivery refiners). By contrast, Ghana’s scheme circumvented the banking system (Bawa Rock is not a commercial bank), and there is no evidence of WGC principles or LBMA engagement. Moreover, the historical Mongolian “Gold-2000” program (2006 – 2015) had the central bank as sole buyer, similar in spirit to GoldBod, but it functioned under stricter compliance rules and evolved as evidence emerged of defects.
- Other Cases: The World Gold Council’s review of ASGM purchase programs (covering Philippines, Mongolia, Ecuador, Ethiopia) shows many countries anchor such programs in development goals (reduce mercury use, formalize miners, protect livelihoods, etc.) Ghana’s GoldBod rhetoric is mostly FX-oriented, with scant attention to these objectives. For example, no public cap on mercury, no cooperative credit lines for miners, and no banking integration are reported in GoldBod reports. In practice, Ghana’s approach looks less like a social development program and more like a state-sponsored FX intervention, leaving Ethiopia and others (which focused on miner incentives and environment) as more holistic precedents.
All three programs (Ghana, Philippines, and Mongolia) share the goal of converting domestic gold into reserves. But Ghana diverges in execution by introducing strange variables.
As outlined in the table below, Ghana’s approach exposes serious tensions with best practices such as monopoly versus market, proximity to central bank funding versus arm’s-length financing, and low transparency versus international standards.
These differences have real consequences: Ghana’s gold flows are less diversified ($10 billion in ~11 months largely to a few buyers in India and the UAE), whereas the Philippines and Mongolia maintain multiple international off-takers to mitigate counterparty risk.
Ghana also seems to have pegged its demand for central bank gold dollars at an unrealistically high level due to a desperate need to over-intervene in the FX market.
| Country | Gold-Purchase Mechanism | Annual ASM Gold (approximate) | Governance/Standards | Purpose & Notes |
| Ghana | Single state-backed firm (Bawa Rock) buys ASM gold; funded by BoG credit. Price = local spot + bonus (has at various times exceeded 5%). | 2025: ~70 – 103 tonnes (formal ASM exports). | No public LBMA accreditation; purchases opaque; limited transparency. | Goal = formalize ASM to boost FX. High risk of laundering and monopoly distortion. |
| Philippines | BSP buys ASM gold via multiple licensed traders and its own refinery. Initially paid premium, but also collected taxes. | Historically: Philippines ~10 -20 tonnes ASM/year (25th global producer). | BSP owns LBMA-accredited refinery (compliance with LBMA RGG). Reporting is transparent. | Purpose = formalize ASM, add reserves. Past tax hikes (2012) hurt volumes, reversed in 2020. Program favors multiple buyers, and has a clear audit platform. |
| Mongolia | BoM buys domestic gold (from large & small miners) through banks. Pays market prices, and channels supportive finance. | ~18 – 20 tonnes /year total (domestic production is ~50 tonnes, including ASM output). | BoM follows WGC London Principles, uses LBMA Good Delivery refiners. Local banks intermediate. | Aim = reserves diversification, and formalization of ASM sector. Tightly integrated with regulation; and focuses on “responsible sourcing” and capacity-building for miners. |
The way forward
We have proposed the Trust-Chain model to preserve the benefits of Ghana’s gold program, which include contributing to reserves accumulation that supports currency stability and formalization of small-scale mining. While at the same time eliminating the inefficiencies stemming from state-dominated trading. This is what we consider to be crucial.
By moving GoldBod “upstream” into a governance and oversight role, and empowering the market to handle trading under transparent rules, the government can still achieve its objectives without directly footing the entire bill. The Trust-Chain would do exactly that: make currency stabilization via gold a shared responsibility of the central bank, finance ministry, private investors, and the mining community – rather than a costly solo venture.
It goes without saying that such a model would only be viable if the Bank of Ghana is not desperately suctioning all the gold in Ghana in a relentless intervention spree to fix the currency at an unrealistic level. Smart modelling is required to better and transparently anchor the right currency fluctuation band (responsive to market conditions), the rational degree of intervention, and the consequentially appropriate volume of gold-dollars the supply of which the central bank must backstop to meet policy goals.
Through the simulations we have started to roll out, it becomes clear that there’s a policy tightrope: Ghana can push certain levers to gather more gold and seek to stabilize the currency, but pushing those same levers too far inflates the cost of the intervention. The dashboard-widget we have implemented visually underscores the core trade-off: aggressive currency support vs. financial losses.
The overriding analytical imperative that analysts and scholars truly committed to a win for Ghana should be focusing on is a program to model the reasonable band of cedi to USD value that warrants intervention, the volumes of gold realistically needed to maintain fluctuation within that band through intervention, and, consequently, the acceptable level of losses justified by the policy benefit, bearing in mind that the performance of the Cedi is not dictated solely by reserve position. Furthermore, such analysis also exposes the scenarios under which gold-dollar driven intervention and its associated costs could become a net negative.
In charting a course to refine its Gold-for-Reserves program, Ghana has the opportunity to set a powerful example. It can demonstrate how a developing country, through ingenuity and reform, turned a quick fix into a permanent feature of economic resilience. Done right, the model could become a blueprint for others. The path could be lighted as to how to leverage natural resources for national stability without succumbing to the pitfalls of opacity or unsustainable costs.
With prudent reforms and an unwavering commitment to transparency, Ghana can strike gold in more ways than one. By securing more than just reserves, the country’s leaders can build trust and wealth for generations to come. Those of us in the knowledge and civil dialogue space – as analysts, academics, and commentators – should be focused on driving higher performance in this fashion instead of generating feel-good vibes for the government through incomplete analysis.
A selection of sources consulted
- Speakers | ICTD, accessed January 12, 2026, https://www.ictd.ac/wp-content/uploads/2024/02/Speaker-profiles.pdf
- Ghana’s Gold Premium Policy Risks Creating Regional Smuggling Hub, https://www.newsghana.com.gh/ghanas-gold-premium-policy-risks-creating-regional-smuggling-hub/
- Liquidity control measures cost BoG GH¢8.6bn in 2024 – The Business & Financial Times, https://thebftonline.com/2025/06/09/liquidity-control-measures-cost-bog-gh%C2%A28-6bn-in-2024/
- ANNUAL STATISTICAL BULLETIN 2024 – Bank of Ghana, , https://www.bog.gov.gh/wp-content/uploads/2025/05/Annual-Statistical-Bulletin-2024.pdf
- Ghana Lost $11.4 Billion to Gold Smuggling in Five Years (Swissaid) – Ecofin Agency, https://www.ecofinagency.com/news-industry/1906-47343-ghana-lost-11-4-billion-to-gold-smuggling-in-five-years-swissaid
- Ghana has lost $11bn to gold smuggling, links to UAE, report finds – Mining Weekly, https://www.miningweekly.com/article/ghana-has-lost-11bn-to-gold-smuggling-links-to-uae-report-finds-2025-06-17
- (PDF) Evaluating Ghana’s resource swap experiment: A critical analysis of the gold for oil program and the Ghana gold board – ResearchGate, https://www.researchgate.net/publication/394160435_Evaluating_Ghana’s_resource_swap_experiment_A_critical_analysis_of_the_gold_for_oil_program_and_the_Ghana_gold_board
- Press Release – Bank of Ghana Appoints Professor Festus Ebo Turkson to the MPC, https://www.bog.gov.gh/news/press-release-bank-of-ghana-appoints-prof-festus-ebo-turkson-to-the-mpc/
- Ghana loses $11 billion in gold smuggling linked to UAE – report – Business Insider Africa, https://africa.businessinsider.com/local/markets/ghana-loses-dollar11-billion-in-gold-smuggling-linked-to-uae-report/kkct4xq
- GoldBod CEO Dismisses Claims of Losses, Clarifies IMF Remarks on Gold-for-Reserve Programme, https://goldbod.gov.gh/goldbod-ceo-dismisses-claims-of-losses-clarifies-imf-remarks-on-gold-for-reserve-programme/
- FULL TEXT: BoG lowers monetary policy rate from 21.5% to 18% – Ghana Web, https://www.ghanaweb.com/GhanaHomePage/business/FULL-TEXT-BoG-lowers-monetary-policy-rate-from-21-5-to-18-2011136
- press release for immediate release publication of the 2024 bank of ghana financial statements, https://www.bog.gov.gh/wp-content/uploads/2025/06/PRESS-RELEASE-PUBLICATION-OF-THE-2024-BANK-OF-GHANA-FINANCIAL-STATEMENTS-JUNE25.pdf
- ‘Our strict aggregator rules is not a monopoly but compliance’ – Ghana GoldBod, https://www.ghanaweb.com/GhanaHomePage/business/Our-strict-aggregator-rules-is-not-a-monopoly-but-compliance-Ghana-GoldBod-2016223
- GOLDBOD: LOSS OR NO LOSS? – Modern Ghana, accessed January 12, 2026, https://www.modernghana.com/news/1462739/goldbod-loss-or-no-loss.html
- GoldBod Backs Gold-for-Reserves Impact with Hard Data, https://goldbod.gov.gh/goldbod-backs-gold-for-reserves-impact-with-hard-data/
- Mining Consultant Questions GoldBod Losses Amid Monopoly Status and High Gold Prices, https://www.newsghana.com.gh/mining-consultant-questions-goldbod-losses-amid-monopoly-status-and-high-gold-prices/
- IMF Executive Board Completes the Fifth Review under the Extended Credit Facility Arrangement with Ghana, https://www.imf.org/en/news/articles/2025/12/17/pr-25429-ghana-imf-completes-the-fifth-review-under-the-ecf-arrangement
- IMF Executive Board Completes the Fourth Review under the Extended Credit Facility Arrangement with Ghana, https://www.imf.org/en/news/articles/2025/07/07/pr-25242-ghana-imf-completes-the-4th-review-under-the-ecf-arrange
- Mongolia’s banking sector is undergoing a major transformation to foster diversified ownership and strengthen corporate governance – Mongolbank.mn, https://www.mongolbank.mn/en/r/10884
- Responsible Gold Sourcing Policy Framework of the Domestic Gold Purchase Programme | Bank of Ghana, https://www.bog.gov.gh/wp-content/uploads/2024/09/Responsible-Gold-Sourcing-Policy-Framework.pdf
- Financial Statements 2021 Ghana – bank of africa, https://bank-of-africa.net/wp-content/uploads/2023/12/GH_EF-2021-VA-Web.pdf
- Annual Report and Financial Statements – Bank of Ghana, https://www.bog.gov.gh/wp-content/uploads/2022/06/AnnRep-2021.pdf
- Bank of Ghana Report and Financial Statements 31 December 2021, https://www.bog.gov.gh/wp-content/uploads/2022/04/Bank-of-Ghana-2021-Audited-Financial-Statements-1.pdf
- Note 13 Interest income and expense in: A Central Bank’s Guide to International Financial Reporting Standards – IMF eLibrary, https://www.elibrary.imf.org/display/book/9781513563602/ch13.xml
- Monetary and Financial Developments – Bank of Ghana, https://www.bog.gov.gh/wp-content/uploads/2022/03/Monetary-and-Financial-Developments-May-2021.pdf
- Monetary and Financial Developments – Bank of Ghana, https://www.bog.gov.gh/wp-content/uploads/2022/03/Monetary-and-Financial-Developments-July-2021.pdf
- Annual Report and Financial Statements – Accra – Bank of Ghana, https://www.bog.gov.gh/wp-content/uploads/2023/07/Annual-Report-2022.pdf
- Bank of Ghana Losses: We spent GHc8.3bn on open market operations, reducing inflation, https://www.youtube.com/watch?v=f62YrkerqhE
- Frequently Asked Questions (FAQS) on Bank of Ghana’s 2022 Published Annual Report and Financial Statements, https://www.bog.gov.gh/wp-content/uploads/2023/08/FAQs-on-BOGs-2022-Annual-Report-August-1-2023.pdf
- 2023 Annual Report and Financial Statements | Bank of Ghana, https://www.bog.gov.gh/wp-content/uploads/2024/05/Bank-of-Ghana-2023-Annual-Report-and-Financial-Statements.pdf
- Ghana: Fourth Review Under the Arrangement Under the Extended Credit Facility, Request for Modification of Performance Criteria, Financing Assurances Review, and Monetary Policy Consultation-Press Release; Staff Report; and Statement by the Executive Director for Ghana in: IMF Staff Country Reports Volume 2025 Issue 175 (2025), https://www.elibrary.imf.org/view/journals/002/2025/175/article-A001-en.xml
- press release by Bank of Ghana, June 25th, 2026, https://www.bog.gov.gh/wp-content/uploads/2025/06/PRESS-RELEASE-PUBLICATION-OF-THE-2024-BANK-OF-GHANA-FINANCIAL-STATEMENTS-JUNE25.pdf
- Ghana’s GH¢8.6 Billion Liquidity Cost in 2024: Inside the Bank of Ghana’s Monetary Strategy – Accounting Firm | East Legon, Accra, https://jsmorlu.com.gh/blog/economy/ghanas-gh%C2%A28-6-billion-liquidity-cost-in-2024-inside-the-bank-of-ghanas-monetary-strategy/
- Monetary Policy Committee Decisions – November 2025 – Bank of Ghana, https://www.bog.gov.gh/news/monetary-policy-committee-decisions-november-2025/
- BANK OF GHANA MONETARY POLICY COMMITTEE PRESS RELEASE 26 November 2025, https://www.bog.gov.gh/wp-content/uploads/2025/11/MPC-Press-Release-November-2025.pdf
- Gold Reserves September 2025 | PDF – Scribd, https://www.scribd.com/document/930427601/Gold-Reserves-September-2025-2
- MONETARY POLICY REPORT – Bank of Ghana, https://www.bog.gov.gh/wp-content/uploads/2026/01/Monetary-Policy-Report_November-2025-1.pdf
- BoG Dismisses Domestic Gold Purchase Programme Loss Claims, Demands Audited Accounts – YouTube, https://www.youtube.com/watch?v=JWfRDx6lQ5E
- Gold Reserves July 2025 2 | PDF – Scribd, https://www.scribd.com/document/899797004/Gold-Reserves-July-2025-2
- Cedi holds strong with 32% surge against dollar in first 11 months of 2025, https://citinewsroom.com/2025/11/cedi-holds-strong-with-32-surge-against-dollar-in-first-11-months-of-2025/
Credit: The Scarab
Latest Stories
-
[Watch Live] Shatta Wale, Kofi Kinaata, and others ignite the grand finale of Gomoa Easter Carnival
1 hour -
Berekum Chelsea edge Aduana FC in Bono derby to boost survival hopes
5 hours -
‘They can’t control the team’ – Ernest Thompson doubts local coaches for Black Stars role
5 hours -
Ghana-born midfielder Seidu realises ‘dream’ with Atlético Madrid debut
6 hours -
GPL 2025/26: Bubakari strikes late to hand All Blacks vital win over Dreams FC
6 hours -
Fatal crash on Kintampo–Tamale highway claims four lives
6 hours -
2025–26 FA Cup Semifinal Draw: Chelsea, Man City Learn Wembley Opponents
6 hours -
GPL 25/26: Gold Stars back on top after beating Nations FC
7 hours -
GPL 2025/26: Heart of Lions roar back with victory over Vision FC in Kpando
7 hours -
Solomon Agbasi: Hearts keeper in stable condition after concussion
7 hours -
GPL 2025/26: Late Salim Adams penalty earns Medeama draw at Bechem
8 hours -
Hearts pip Young Apostles 1-0 to end 5-game winless run
8 hours -
Boakye Agyarko marks Easter Sunday with a call for Godly leadership ahead of nationwide campaign tour
9 hours -
Pepsi withdraws as UK festival sponsor after Kanye West backlash
9 hours -
Pope Leo calls for global leaders to choose peace in his first Easter Mass
9 hours