
Audio By Carbonatix
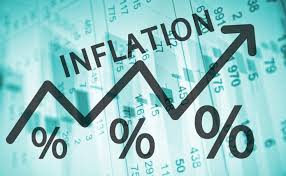
The national year-on-year inflation rate for April 2020 hits 10.6%, which is 2.8 percentage points higher than last month, the Ghana Statistical Service has said.
The year-on-year inflation for March 2020 was at 7.8 per cent. The Month-on-month inflation between March 2020 and April 2020 was 3.2%.
These are highest recorded year-on-year and month-on-month inflation rates since the CPI rebasing in August 2019.
Inflation rates for Food and Non-Alcoholic Beverages was at 14.4% and Housing, Water, Electricity, and Gas at 11.2%.
Food and Non-food Inflation
The Food and Non-alcoholic Beverages Division recorded a year-on-year inflation rate of 14.4%. This is 6 percentage point higher than March 2020 (8.4%) and 6.5 percentage points higher than the average Food inflation rate recorded in the previous eight months (7.9%).
This translates to Food being the predominant driver of year-on-year inflation. Food contributed 59.6% of the year-on-year inflation in April 2020.
In the previous eight months, this contribution was on average 44.1%.
Month-on-month Food inflation stood at 6.4%, meaning that between March 2020 and April 2020 the average price level of Food and Non-alcoholic beverages increased by 6.4%.
Food is also the predominant driver of month-on-month inflation. Within the Food Division, Vegetables (+37%) and Fruits & Nuts (+ 20.5%) were the Subclasses with the highest rates of inflation for both year-on-year and month-on-month inflation.
Within the Housing, Water, Electricity, and Gas Division (+11.2%), the Subclasses ‘Solid Fuels (16.7%)’ and ‘Materials for the Maintenance and Repair of Dwelling (13.1%)’ recorded the highest inflation rates.
Regional Inflation
At the regional level, the overall year-on-year inflation ranged from 2.3% in the Upper East Region to 15.1% in Greater Accra.
Greater Accra (20.8%) and Ashanti (18.2%) had the highest rates of Food inflation, while Eastern Region saw the highest Non-food inflation (12.5%). Upper East, Northern, Eastern, and Central Region experienced higher NonFood than Food inflation, the opposite was true for the other six regions.
Imported and Local Inflation
Inflation of imported goods was 4.9%, while the inflation of local goods was 13.1% on average. This is the highest rate of local inflation and the lowest rate of imported goods inflation since the rebasing in August 2019.
The month-on-month inflation for imported goods was 0%, while month-on-month inflation for local goods was 4.5%. The main contributor to local inflation was the inflation of locally produced foods.
Latest Stories
-
GhIE, Ghana Navy partner to strengthen engineering professionalism
2 minutes -
ICU urges President Mahama to revitalise VALCO, PBC and distressed state-owned enterprises
3 minutes -
Pile-up crash blocks Accra-Kumasi Highway at Birimso Bridge
5 minutes -
Chairman of Church of Pentecost: Judges must uphold integrity and conscience in justice delivery
16 minutes -
Fire at Wa Islamic SHS displaces 138 students, damages 6 dormitories
17 minutes -
Omaya Care wins inaugural Ghana AI Innovation Challenge with maternal health solution
20 minutes -
Young gospel musicians use my songs without permission – Obaapa Christy
23 minutes -
The Ghanaian Researcher challenging how social media platforms treat neurodivergent users
30 minutes -
NPA to revise diesel price floor following government’s GH¢2 per litre subsidy
39 minutes -
Reform-LBG engages stakeholders to support peacebuilding and livelihoods project in Lewuniyiri
45 minutes -
QNET reaffirms zero tolerance for human trafficking and fraud following reports from Côte d’Ivoire
46 minutes -
JoyNews, IMANI to host national dialogue on plastic waste management
55 minutes -
GWCL explains cause of water shortage in parts of Accra
57 minutes -
Five Ghana football legends honoured by BRÜHM
57 minutes -
Boxing officials urge NSA and Ghana Sports Fund to invest in grassroots athlete development
59 minutes